

Cisco + Splunk
Today, all organisations rely on highly complex, interconnected IT ecosystems spanning on-premises, hybrid cloud and multi-cloud environments. However, as they scale, they face increasing operational challenges such as rising system outages, inefficient incident resolution and disjointed monitoring tools that create visibility gaps across their technology stack. The concept of Observability comes into play.
This blog is not about what observability is however there is a quick intro here by Splunk. It is also not a comparative of what is in the market, you can have a read of the gartner magic quadrant reprint here. No, this blog focuses on to coin a phrase ‘Full Stack Observability’ namely how Cisco + Splunk have brought together their products in the space to achieve observability solutions.
Benefits of Observability
A Forrester Total Economic Impact (TEI) study commissioned (found here) by Splunk found that businesses without full-stack observability often experience:
- Frequent costly outages—before deploying observability, organisations struggled with an average of 12 major outages per year, each lasting 8+ hours.
- Siloed IT teams and tool sprawl, causing delays in identifying and resolving issues.
- High operational costs with legacy monitoring solutions, providing limited visibility and requiring costly maintenance.
- Developer inefficiency, as engineers spend time firefighting alerts instead of focusing on innovation.
The requirement therefore follows for full-stack observability solutions like Splunk Observability and Cisco AppDynamics, organisations have realised significant improvements:
- 70% fewer outages and 75% reduction in Mean Time to Resolution (MTTR), leading to millions in saved revenue.
- Increased developer productivity, cutting alert fatigue by 70% and allowing teams to focus on strategic initiatives.
- $2.3M saved by consolidating outdated, disconnected monitoring tools into a single observability platform.
With Cisco’s recent acquisition of Splunk, the integration of AppDynamics, Splunk Observability Cloud, and Splunk IT Service Intelligence (ITSI) the idea being to vastly improve how enterprises monitor, analyse, and optimise their entire technology stack. This blog explores how these solutions work together to provide a unified full-stack observability platform, helping businesses proactively detect, diagnose and mitigate performance and security risks before they impact customers.
The Cisco-Splunk Observability Ecosystem
The Visuals…
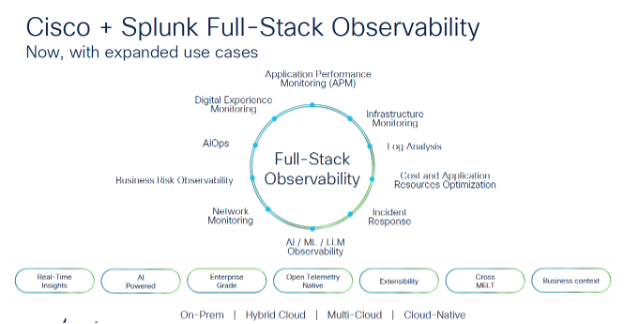
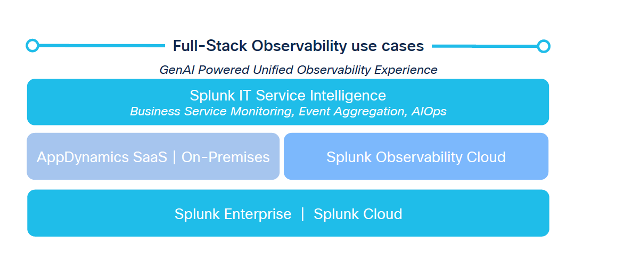
Fig1. Courtesy of 2025 cisco live
Splunk Enterprise / Cloud (Splunk Platform)
Not always, but likely, it starts with Splunk Platform to collect and analyse structured and unstructured data in any format across your estate. Please also refer to our other blogs on data pipelining and future telemetry, data collection blogs. We’ll gloss over this part as its not the focus of the blog.
Splunk Observability Cloud
Splunk’s Observability Cloud provides AI-driven analytics, real-time monitoring, and event correlation across applications, infrastructure and security environments. Its key capabilities include:
- Real-time log analytics to detect anomalies.
- Unified Application Performance Monitoring (APM) with detailed trace analytics.
- Infrastructure monitoring for cloud, hybrid, and on-prem systems.
- Digital experience monitoring to assess user interactions across platforms.
Its blend of key capabilities is targeted at cloud and micro-services environments.
AppDynamics: Deep-Dive into Application Performance
AppDynamics, Cisco’s Application Performance Monitoring (APM) solution, is essential for ensuring business-critical applications run optimally. With deep visibility into transactions, dependencies and business context, AppDynamics enables:
- Transaction tracing & flow mapping for hybrid applications.
- End-to-end visibility across cloud-native and legacy environments.
- AI-powered anomaly detection to predict and prevent issues before they impact users.
- Real-time correlation of performance metrics with business KPIs.
It would not be untoward to state AppDynamics is focused on Three-tier (monolithic) applications therefore, making a good fit with Splunk Observability Cloud for cloud native and micro-services environments. It’s also worth mentioning the tight integrations with the CISCO network mon and software portfolio, give AppDynamics deeper insight into CISCO environments.
Splunk IT Service Intelligence (ITSI): Business-Centric Observability
Splunk’s IT Service Intelligence (ITSI) extends observability beyond technical metrics by integrating with the above portfolio to deliver:
- Business service monitoring, aligning IT health with revenue-impacting KPIs.
- Event Aggregation (AIOps) correlation, reducing alert fatigue and improving root cause analysis.
- Proactive risk observability, predicting and mitigating business-impacting outages.
The key to ITSI, is building upon the rest of the portfolio’s alert data, events and telemetry building out KPI’s and other insights to the business services, overall health and other KPI’s that matter to your organisation.
How AppDynamics Integrates with Splunk for Full-Stack Observability
Cisco and Splunk’s integration strategy positions AppDynamics as the core application monitoring component in a unified observability framework for monolithic and three tier environments. Core APM for cloud and microservices falls more naturally to Splunk Observability clous. Both integrations bridge the gap between application, network and infrastructure monitoring, delivering:
Unified Visibility Across the Stack
By integrating AppDynamics’ APM or Splunk Observability cloud capabilities with Splunk’s log analytics and ITSI, organisations can achieve cross-domain visibility. Key benefits include:
- Contextual troubleshooting: Logs and traces from AppDynamics and / or Splunk Observability feed into Splunk for deeper incident analysis.
- Single Pane of Glass: A unified interface for developers, IT Ops, and security teams to monitor performance and detect issues.
- Reduced mean time to detect (MTTD) and mean time to resolve (MTTR) using AI-driven event correlation.
End-to-End Transaction Monitoring
AppDynamics’ transaction tracing integrates with Splunk’s log analytics to provide root cause visibility across distributed services. This allows teams to:
- Trace slow transactions across microservices and legacy apps.
- Analyse correlated logs to pinpoint failures at the infrastructure or network level.
- Diagnose performance degradation based on real-time data, avoiding costly downtimes.
AI-Driven Insights for Proactive Problem Resolution
With Splunk’s AI and machine learning models, AppDynamics data can be used to:
- Predict outages and anomalies before they impact customers.
- Automate remediation actions through intelligent alerts.
- Optimise resource utilisation by correlating application performance with infrastructure efficiency.
Business Risk Observability & Security Integration
Beyond performance monitoring, AppDynamics + Splunk ITSI provides business-centric observability:
- Security risk monitoring through integration with Cisco ThousandEyes and Splunk Security solutions.
- Application security observability, leveraging Cisco’s Secure Application features.
- Business impact analysis, connecting application health to revenue-driven KPIs.
The Future of Full-Stack Observability with Cisco + Splunk
With AppDynamics, Splunk Observability Cloud, and ITSI, Cisco is delivering a next-generation observability platform that provides:
- Real-time insights across infrastructure, applications, and security.
- AI-powered automation to reduce alert fatigue and resolve issues faster.
- Business-centric monitoring that aligns IT performance with revenue.
For enterprises navigating the complexities of hybrid and multi-cloud environments, the Cisco-Splunk acquisition marks a pivotal shift toward a more connected and intelligent observability ecosystem. It uses the strengths of the products for their original design, which makes logical sense.
We believe licencing changes are afoot to bring together an easier, more unified way of licencing the full observability stack, as opposed to separate licencing for each component. This will make the purchasing decision and ROI much more straightforward to calculate.
Conclusion
The combination of Splunk Observability Cloud, ITSI, and AppDynamics creates an a full-stack observability solution. As the integration deepens, enterprises will unlock even greater visibility, automation and intelligence, redefining the way IT teams operate in a digital-first world. The licencing changes should make it an easier purchasing decision through clarity of future costs. If you are Splunk user and want to move more into APM or indeed full observability, it’s certainly worth exploring.


See how we can build your digital capability,
call us on +44(0)845 226 3351 or send us an email…